Average Issue Time Spent In Emotions
- Prashant Kukde
Owned by Prashant Kukde
Last updated: Sept 18, 2018
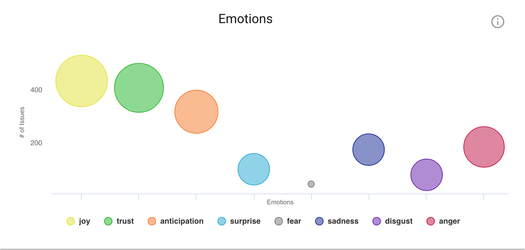
The chart helps you analyze which emotions are your teams' expressing at the issue level? And for how long are these emotions expressed?
The chart can be used to detect issues with positive or negative emotions and consider questions like:
- Do the team members express negative opinions? Which issues, in particular, are affected by negative emotions?
- Can this information be used to help teams' collaborate better?
- Is there a strong correlation between the teams' emotions and their productivity?
Check out our recent case study with Atlassian to analyze the impact of emotions on teams' productivity.
This chart helps you identify how your team is communicating. A bigger blob of negative emotions is typically a red flag. You can click on any emotion blob and it will take you to the list of issues which have that emotion. This can help you to immediately identify issues which require your attention.
, multiple selections available,